What Planting Zone Am I In? USDA Hardiness Zones by ZIP Code
Your hardiness zone is set by the average coldest night of the winter, in 10°F zones split into 5°F "a" and "b" halves, from zone 1a (coldest) to 13a. Use it to choose perennials, shrubs, trees and bulbs that survive your winters. Use your frost dates, not your zone, to decide when to plant.
Zone data: 2023 USDA Plant Hardiness Zone Map ZIP code listings (PRISM Climate Group, Oregon State University). This site's pages are not the official USDA map.
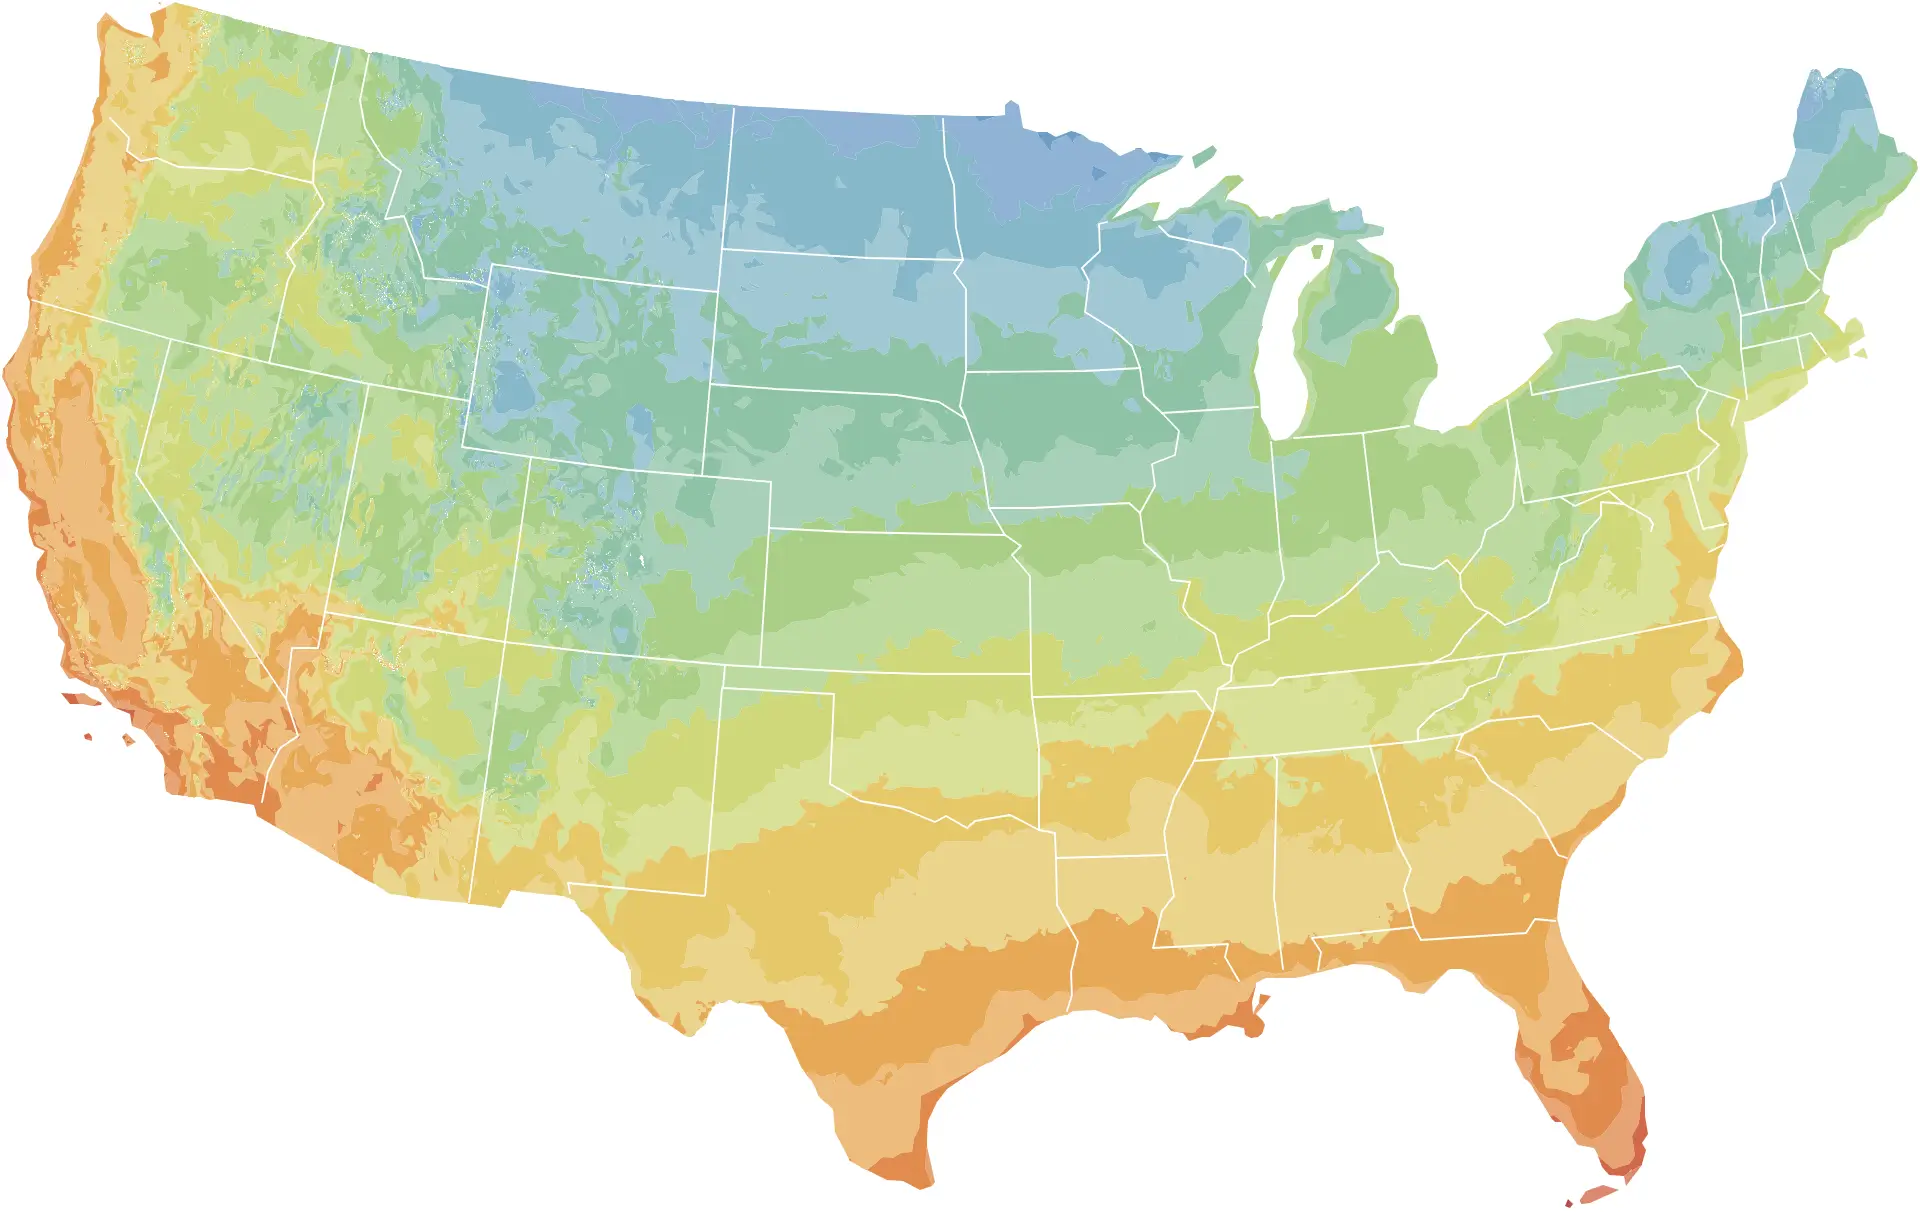
Hardiness zone map
- 3
- 4
- 5
- 6
- 7
- 8
- 9
- 10
- 11
- Darker shade: "a" half zone; lighter: "b"
Hardiness zones in the 48 contiguous states, drawn from the 2023 USDA Plant Hardiness Zone Map GIS data (PRISM Climate Group, Oregon State University) and simplified for display. This is not the official USDA Plant Hardiness Zone Map. Zones in mountain areas vary over short distances; use the ZIP code finder for your own zone. Alaska, Hawaii and Puerto Rico are listed in the table below.
All zones
| Zone | Coldest night | Typical last frost | Where |
|---|---|---|---|
| Zone 1a | -60 to -55°F | Too few stations | AK |
| Zone 1b | -55 to -50°F | Too few stations | AK |
| Zone 2a | -50 to -45°F | May 19 | AK |
| Zone 2b | -45 to -40°F | Too few stations | AK |
| Zone 3a | -40 to -35°F | May 26 | AK, MN |
| Zone 3b | -35 to -30°F | May 17 | MN, ND, AK, MT |
| Zone 4a | -30 to -25°F | May 13 | ND, MN, WI, MT |
| Zone 4b | -25 to -20°F | May 8 | MN, WI, SD, MT |
| Zone 5a | -20 to -15°F | May 3 | IA, MN, WI, SD |
| Zone 5b | -15 to -10°F | May 1 | IL, NY, IA, NE |
| Zone 6a | -10 to -5°F | Apr 29 | IL, MI, OH, IN |
| Zone 6b | -5 to 0°F | Apr 23 | PA, OH, MO, KS |
| Zone 7a | 0 to 5°F | Apr 16 | KY, PA, WV, VA |
| Zone 7b | 5 to 10°F | Apr 5 | TN, OK, NY, VA |
| Zone 8a | 10 to 15°F | Mar 29 | NC, AR, TX, GA |
| Zone 8b | 15 to 20°F | Mar 17 | TX, AL, GA, MS |
| Zone 9a | 20 to 25°F | Mar 2 | TX, LA, FL, CA |
| Zone 9b | 25 to 30°F | Jan 31 | CA, TX, FL, AZ |
| Zone 10a | 30 to 35°F | Frost rare | CA, FL, TX, AZ |
| Zone 10b | 35 to 40°F | Frost rare | CA, FL, TX, HI |
| Zone 11a | 40 to 45°F | Frost rare | FL, CA, HI |
| Zone 11b | 45 to 50°F | Frost rare | FL, HI |
| Zone 12a | 50 to 55°F | Frost rare | HI |
| Zone 12b | 55 to 60°F | Frost rare | HI |
| Zone 13a | 60 to 65°F | Frost rare | HI |
What a hardiness zone measures
A plant hardiness zone describes one number: the average annual extreme minimum temperature, which is the coldest night of each winter averaged over a 30-year period. The 2023 USDA map uses 1991-2020 weather data. Zones are 10°F wide, from zone 1 (coldest) to zone 13 (warmest), and each is split into a colder “a” half and a warmer “b” half 5°F apart. The table above lists the range for every half zone.
That single number decides more than any other whether a perennial plant survives winter where you live, which is why nursery tags and catalogs list a zone range. A shrub rated for zones 5-9 should come through a typical zone 5 winter. It does not promise survival in every winter: the zone is an average, not the coldest temperature ever recorded. USDA warns that a plant grown at the cold edge of its range can thrive for years and then die in one rare cold snap lasting a day or two.
Hardiness zones matter for perennials, shrubs, trees, fruit plants and bulbs left in the ground. They matter very little for annual vegetables and flowers, which live for one season and never face a winter.
What changed on the 2023 map
USDA’s Agricultural Research Service and Oregon State University’s PRISM Climate Group released the current map in November 2023, replacing the 2012 edition. The main changes:
- Newer data. The map is built from 1991-2020 temperatures, the same 30-year period NOAA uses for its current climate normals.
- More stations. It draws on 13,412 weather stations, against 7,983 for the 2012 map.
- About half the country moved. Compared with 2012, roughly half of the country shifted to the next warmer half zone; the other half stayed where it was.
- Finer detail in Alaska. Alaska is now mapped at a much finer resolution and comes out warmer, largely because more data from mountain areas captures the mild air that sits above cold valley floors in winter.
- Zones 12 and 13. These frost-free zones, for coldest nights above 50°F and 60°F, cover only Hawaii and Puerto Rico.
USDA cautions against reading the shifts as a measure of climate change. The coldest night of the year swings widely from winter to winter, and some boundary changes reflect more stations and better mapping methods. If your zone number went up, USDA’s advice is not to replace your garden: what has thrived in your yard will most likely continue to.
Why your garden may not match your zone
The map is drawn at a half-mile scale, but no map captures every yard. USDA points to several reasons a garden can be warmer or colder than its zone:
- Cities hold heat in concrete and pavement, so a downtown can sit a zone warmer than nearby countryside.
- Elevation: hilltops and mountains are colder than surrounding lowland.
- Large bodies of water that stay unfrozen moderate winter, especially downwind.
- Frost pockets: cold air drains into low spots and collects there first.
- Sheltered spots, such as the area in front of a south-facing wall, run warmer than the rest of the yard.
Cold is not the only thing that kills plants in winter. USDA lists wind, soil type, soil moisture, humidity, snow and winter sun as factors, and notes that plants entering winter dry are more easily injured. A sudden hard freeze in early fall, or a warm spell in midwinter followed by a sharp drop, can damage plants even when the zone’s average low is never reached.
Zones and frost dates are different things
This is the most common source of confusion in planting advice. A zone measures how cold winter gets. A frost date measures when the last spring frost and first fall frost usually occur. The two are related, but loosely.
Places in the same zone can have very different springs. Chicago and Denver are both in zone 6a, yet Chicago’s typical last frost comes in mid-April and Denver’s in early May. Seattle and Austin are both in zone 9a, with last frosts in early March and late February, but Austin’s average daily temperature reaches 60°F in early March and Seattle’s not until early June, so tomatoes go in months apart. Within a single half zone such as 6b, the typical last frost across its ZIP codes spans about four weeks.
That is why this site uses each ZIP code’s own frost dates, from the nearest NOAA weather station’s 1991-2020 records, to time vegetables and annual flowers, and keeps zones for choosing what survives the winter. Each zone page shows the range of frost dates found within that zone.
About these zone tables
The zone shown for each ZIP code comes from the 2023 USDA Plant Hardiness Zone Map ZIP code data published by the PRISM Climate Group at Oregon State University. This site’s zone finder, tables and zone pages are derived from that data and are not the official USDA Plant Hardiness Zone Map. To see the official interactive map, visit the USDA Agricultural Research Service’s Plant Hardiness Zone Map website.
Questions
What does my planting zone mean?
It is the average of the coldest night of each winter over 1991-2020 at your location, grouped into 10°F zones and 5°F half zones. A plant rated to your zone or a colder one should normally survive your winters.
Did my zone change on the 2023 map?
Possibly. USDA says about half of the country moved to the next warmer half zone compared with the 2012 map, and the other half stayed in the same half zone. USDA also advises that plants already thriving in your yard will most likely keep thriving.
Does the 2023 zone map prove climate change?
USDA cautions against reading it that way. The coldest night of the year varies a lot from year to year, and some zone changes come from more weather stations and better mapping methods rather than warming.
Can I use my zone to decide when to plant vegetables?
Not reliably. Two places in the same zone can have last frosts weeks or even months apart. For vegetables and annuals, use the frost dates for your ZIP code, which the zone finder above links to.
What is the difference between zone 7a and 7b?
The "a" half is the colder 5°F of the zone and "b" the warmer 5°F. In zone 7a the coldest winter night averages 0 to 5°F; in 7b, 5 to 10°F.
Sources
- USDA Unveils Updated Plant Hardiness Zone Map · USDA Agricultural Research Service
- Plant Hardiness Zone Map: How to Use the Maps · USDA Agricultural Research Service
- Plant Hardiness Zone Map: Map Creation · USDA Agricultural Research Service
- U.S. Climate Normals · NOAA National Centers for Environmental Information